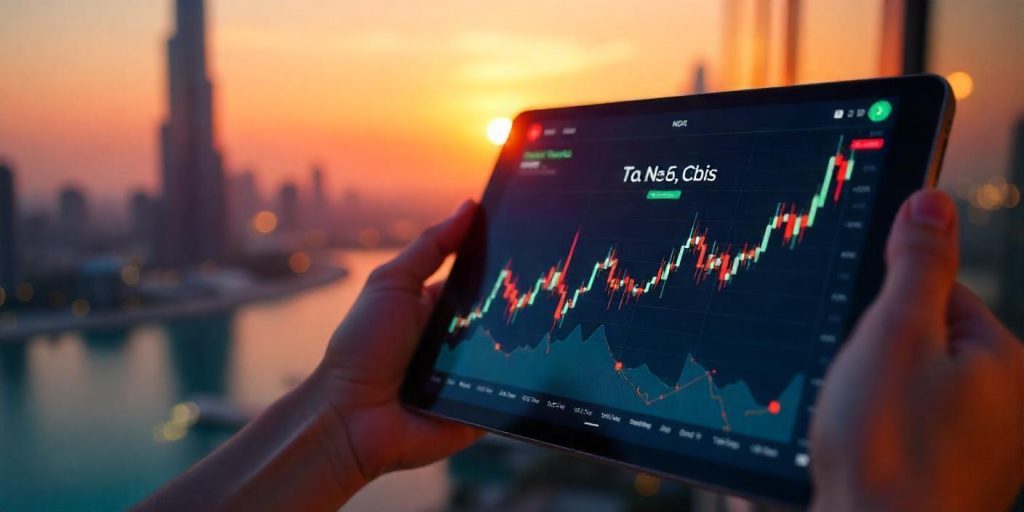
Candlestick Charts are probably among the most favored tools in trading. The chart visually presents clear price movements, enabling the trader to make wise decisions concerning when, what, and how much to trade. Candlesticks were first used in Japan centuries ago, trading rice, but today it’s widely used in forex, stocks, among other markets.
Understanding Candlestick Charts
A candlestick chart is a combination of the so-called “candlesticks,” or displayed time frames (one minute, one day, one week), each with four key levels of prices: open, close, high, and low. The body of the candle must be at least an open and a closing price; wicks or shadows mean the highest and lowest prices during the calculated period. Usually, the color of the candle itself would indicate the direction of the price movement: green or white for a rise; red or black for a fall.
Important Candlestick Patterns
Candlestick patterns are an integral part of identifying potential market movements. Here are a few of the basic patterns used within chart trading:
- Doji: When the open and close are approximately the same, it shows indecision. Many times, this gives a signal for the trend to reverse.
- Hammer: It has a small body with a long lower wick; this suggests that there may be a bullish reversal after an asset downtrend.
- Engulfing patterns: A larger candle completely engulfs the earlier one. These are reversal signals, bullish engulfing for upside reversals and bearish for downside reversals.
- These types of patterns enable traders to predict an imminent price movement or trend in trading charts, thus enabling them to make trades on time.
Why Candlestick Charts Matter when Trading
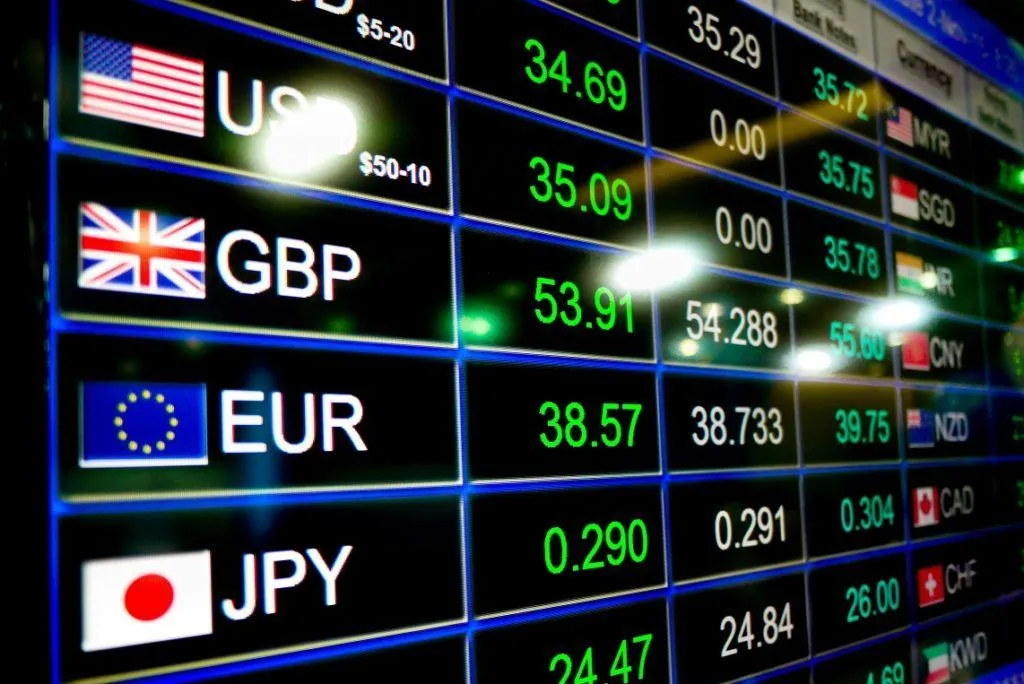
For traders in the foreign exchange market, candlestick charts allow them to see at a glance the price trend and market sentiment. Unlike pure line charts, which do not indicate the psychology behind the price moves of an asset, candlesticks help traders arrive at points of entry, exit, and stop-loss more precisely. Thus, they are of great importance independently for strategies of any time frame, whether it be short- or long-term.
Practical Application in Forex and Beyond
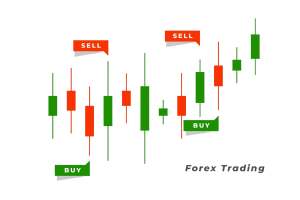
In the study of forex candlestick patterns, identification of these patterns can enable one to at least try to project what will happen in the future with respect to prices. For example, if a hammer pattern comes about during a downtrend, there is most likely going to be a reversal, and hence, a buy could be considered. Conversely, if a bearish engulfing pattern presents itself, a drop in price might be forthcoming, and therefore, a sell may be considered.
Conclusion
The candlestick chart is the basic tool of any trader. The charts give insight into the trend in the market, a view of the formation of a trade, and an avenue toward better decision-making. Mastering the candlestick patterns brings great improvement in one’s trading strategy, right from the novice to the professional trader.